Executive Dashboard for SaaS Financial & Subscription Insights
Executives were flying blind. Subscription activity lived in one system, costs in another, and customer value was scattered across spreadsheets. Without a unified, real-time view, leadership couldn’t answer basic questions: Are we profitable this quarter? Are we retaining customers? Is growth sustainable? Decisions were slowed, and financial risk mounted until Lunexa Insights built a centralized dashboard that brought clarity in minutes, not months.
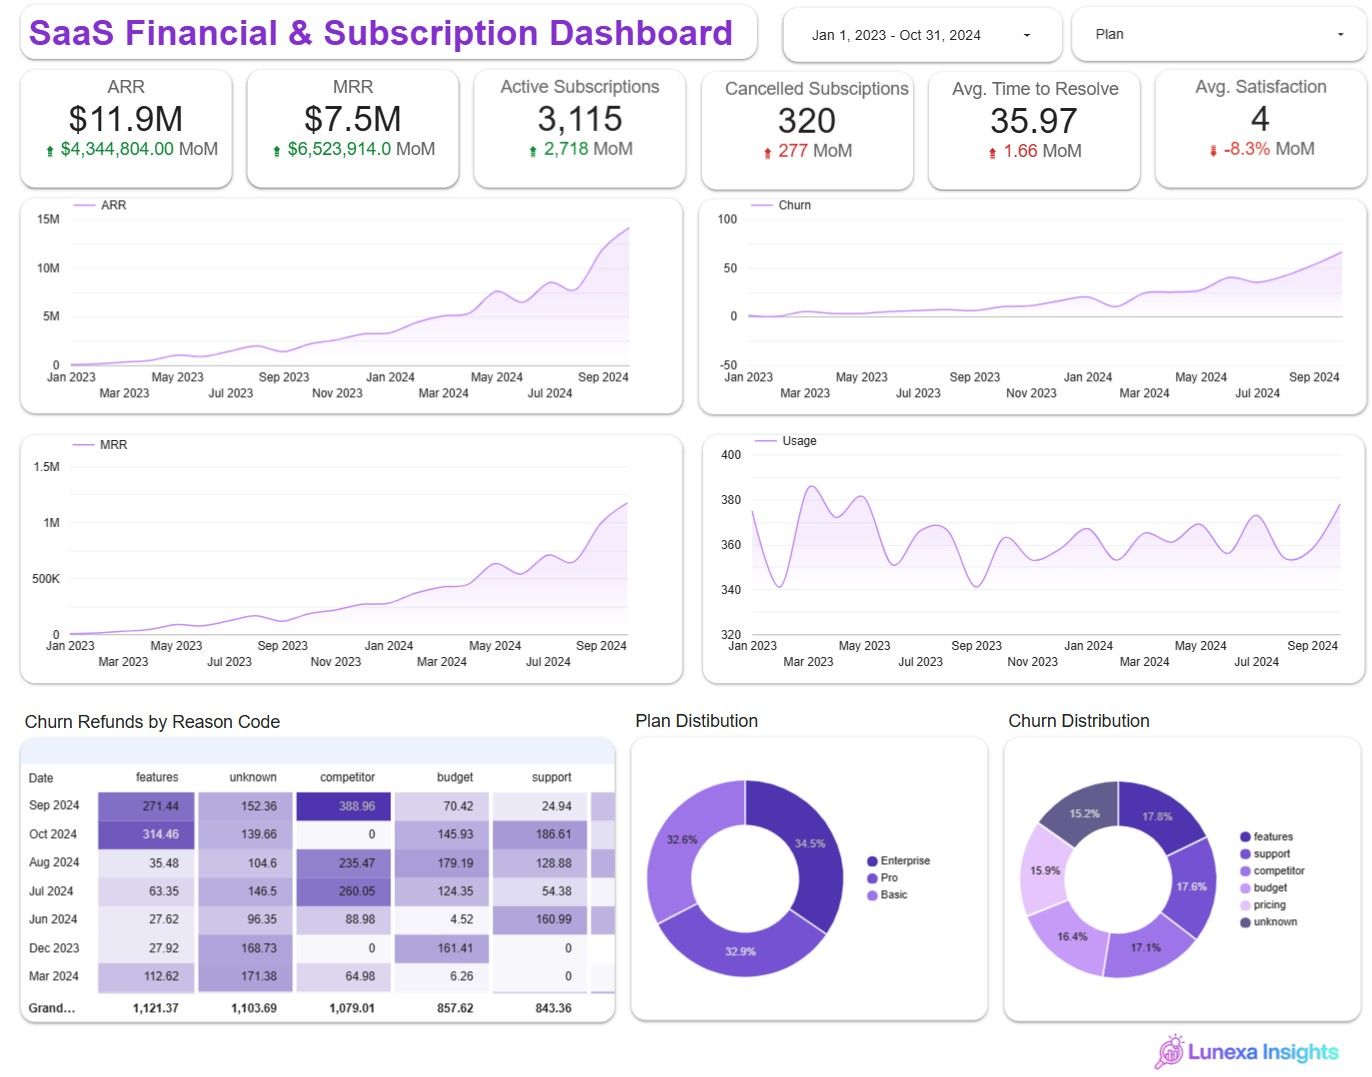

Context
RavenStack, a mid-stage SaaS startup, needed a comprehensive investor-ready KPI report built from multiple raw datasets. Their data included accounts, subscriptions, churn events, feature usage, and support tickets, but it was unstructured and siloed across systems. The company sought clarity on financial performance, customer behavior, and churn dynamics heading into a critical fundraising round.
Objective
To design and implement a dynamic, investor-ready KPI dashboard that gives startup founders and stakeholders clear, up-to-date visibility into key business metrics:
- Monthly Recurring Revenue (MRR)
- Customer Churn
- Customer Acquisition Cost (CAC)
- Customer Lifetime Value (LTV)
- Revenue Growth Rate

Role
Senior Data Analyst (designed and implemented all reporting and analysis)
Duration
3 weeks (data exploration, metric development, analysis and visual dashboard delivery)
Tools & Methodologies
- Python (Pandas, Seaborn, Matplotlib) for analysis and visualization
- Custom logic for SaaS metric computation (MRR, LTV, CAC, churn)
- Cohort and funnel analysis, acquisition segmentation
- CSV files and flat data ingestion (local RavenStack exports)

The Approach and Process
Key SaaS Metrics Analysis
- Data Loading & Auditing: Ingested five datasets (accounts, subscriptions, churn events, feature usage and support tickets). Verified schema and cleaned missing/invalid values.
- Data Exploration: Profiled account churn, subscription lifecycle, plan tier distribution, and customer acquisition patterns. Converted all date columns to datetime format for consistency.
1. Monthly Recurring Revenue (MRR)
MRR has shown exceptional growth, reaching $10.7M in December 2024. The growth trajectory is particularly strong in the latter half of 2024.
subscriptions['start_month'] = subscriptions['start_date'].dt.to_period('M')subscriptions['end_month'] = subscriptions['end_date'].dt.to_period('M')date_range = pd.period_range(start='2023-01', end='2024-12', freq='M')mrr_timeline = []for month in date_range: active_subs = subscriptions[ (subscriptions['start_month'] <= month) & ((subscriptions['end_month'] >= month) | (subscriptions['end_date'].isna())) ] total_mrr = active_subs['mrr_amount'].sum() mrr_timeline.append({'month': month, 'mrr': total_mrr})mrr_df = pd.DataFrame(mrr_timeline)mrr_df['month_str'] = mrr_df['month'].astype(str)print("MRR Growth Over Time:")print(mrr_df.tail(10))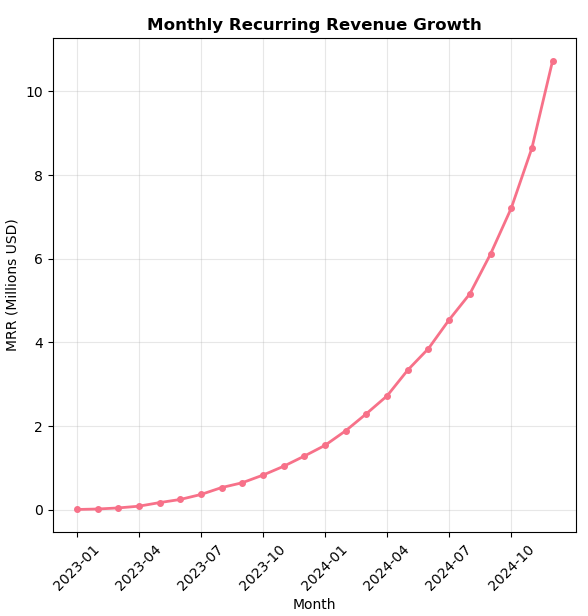
2. Churn Rate Analysis
120% churn rate, meaning more customers have left than you've ever acquired. This is mathematically possible when:
- Customers can churn multiple times (reactivations)
- The time periods don't align properly
- There's fundamental business crisis
This data suggests either a major product failure, competitive disruption, or fundamental business model breakdown in late 2024
churn_events['churn_month'] = churn_events['churn_date'].dt.to_period('M')monthly_churn = churn_events.groupby('churn_month').size().reset_index(name='churned_accounts')monthly_active = []for month in date_range:month_start = month.start_timeactive_accounts = accounts[accounts['signup_date'] <= month_start]churned_before = churn_events[churn_events['churn_date'] < month_start]net_active = len(active_accounts) - len(churned_before)monthly_active.append({'month': month, 'active_accounts': max(0, net_active)})active_df = pd.DataFrame(monthly_active)churn_analysis = active_df.merge(monthly_churn, left_on='month', right_on='churn_month', how='left')churn_analysis['churned_accounts'] = churn_analysis['churned_accounts'].fillna(0)churn_analysis['churn_rate'] = (churn_analysis['churned_accounts'] / churn_analysis['active_accounts'] * 100).round(2)print("Monthly Churn Analysis (Last 10 months):")print(churn_analysis[['month', 'active_accounts', 'churned_accounts', 'churn_rate']].tail(10))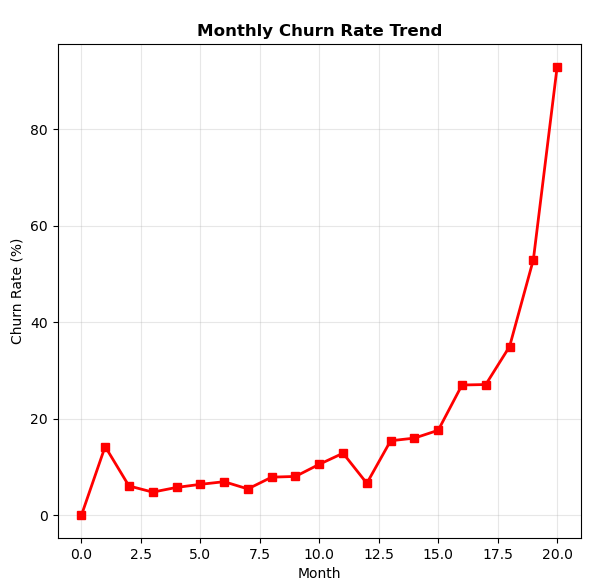
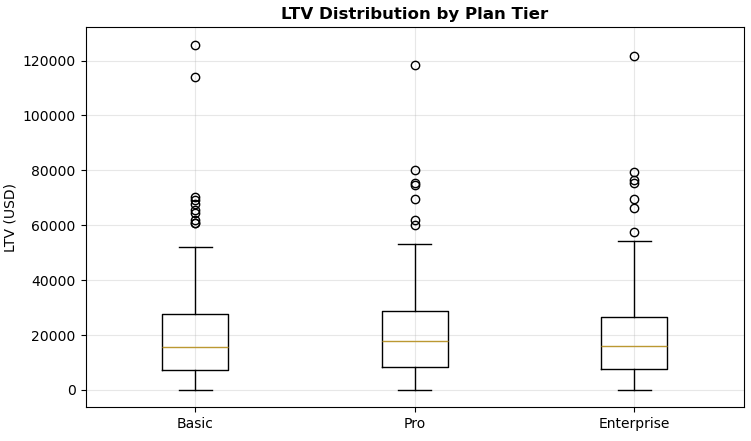
3. Customer Lifetime Value (CLTV)
Key LTV Insights:
- Average LTV: $20,741
- Median LTV: $16,330
- Pro tier customers have the highest average LTV at $21,212
subscription_ltv = subscriptions.groupby('account_id').agg({ 'mrr_amount': 'mean', 'start_date': 'min', 'end_date': 'max', 'subscription_id': 'count'}).reset_index()subscription_ltv['duration_days'] = (subscription_ltv['end_date'] - subscription_ltv['start_date']).dt.dayssubscription_ltv['duration_months'] = (subscription_ltv['duration_days'] / 30.44).round(2)subscription_ltv['total_revenue'] = (subscription_ltv['mrr_amount'] * subscription_ltv['duration_months']).round(2)ongoing_mask = subscription_ltv['end_date'].isna()subscription_ltv.loc[ongoing_mask, 'duration_months'] = 12 # Assume 12 months for ongoingsubscription_ltv.loc[ongoing_mask, 'total_revenue'] = subscription_ltv.loc[ongoing_mask, 'mrr_amount'] * 12print("LTV Analysis Summary:")print("Average LTV: $" + str(subscription_ltv['total_revenue'].mean().round(2)))print("Median LTV: $" + str(subscription_ltv['total_revenue'].median().round(2)))print("LTV by Plan Tier:")ltv_with_plans = subscription_ltv.merge(accounts[['account_id', 'plan_tier']], on='account_id', how='left')ltv_by_plan = ltv_with_plans.groupby('plan_tier')['total_revenue'].agg(['mean', 'median', 'count']).round(2)print(ltv_by_plan)
4. Customer Acquisition Analysis
Acquisition is well-distributed across channels, with organic and ads being strong performers. Enterprise customers show good acquisition numbers across all channels.
acquisition_analysis = accounts.groupby(['referral_source', 'plan_tier']).agg({ 'account_id': 'count', 'seats': 'mean'}).round(2)acquisition_analysis.columns = ['accounts_acquired', 'avg_seats']print("Customer Acquisition by Source and Plan:")print(acquisition_analysis)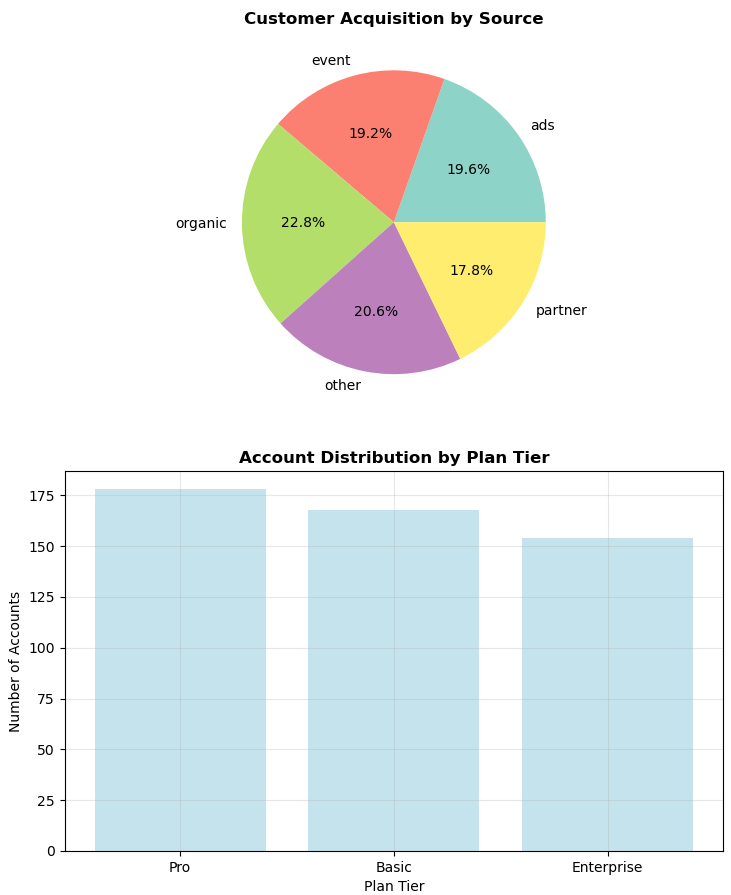
5. Growth Rate Analysis
- Unified visibility into subscription lifecycle and financial impact
- Current MRR: $10,734,251
- Previous month MRR: $8,647,936
- MoM Growth: 24.13%
mrr_df['mrr_growth'] = mrr_df['mrr'].pct_change() * 100mrr_df['mrr_growth'] = mrr_df['mrr_growth'].round(2)print("MRR Growth Rate Analysis:")print("Recent MRR Growth Rates (Last 6 months):")print(mrr_df[['month_str', 'mrr', 'mrr_growth']].tail(6))current_mrr = mrr_df['mrr'].iloc[-1]previous_mrr = mrr_df['mrr'].iloc[-2]mom_growth = ((current_mrr - previous_mrr) / previous_mrr * 100).round(2)print("\Key Growth Metrics:")print("Current MRR: $" + str(current_mrr))print("Previous Month MRR: $" + str(previous_mrr))print("Month-over-Month Growth: " + str(mom_growth) + "%")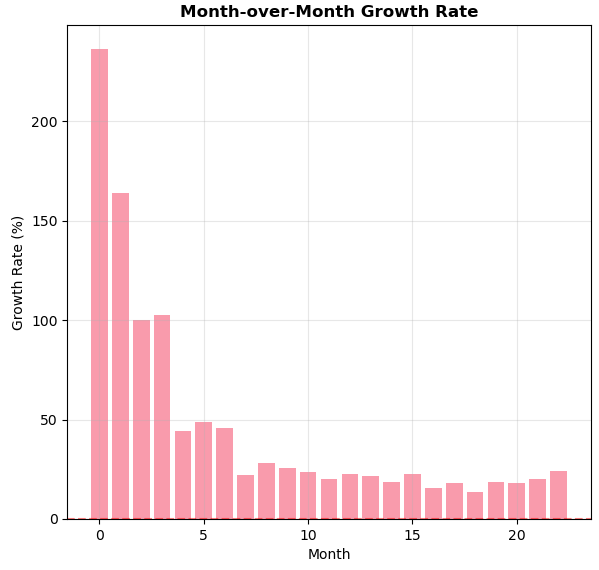
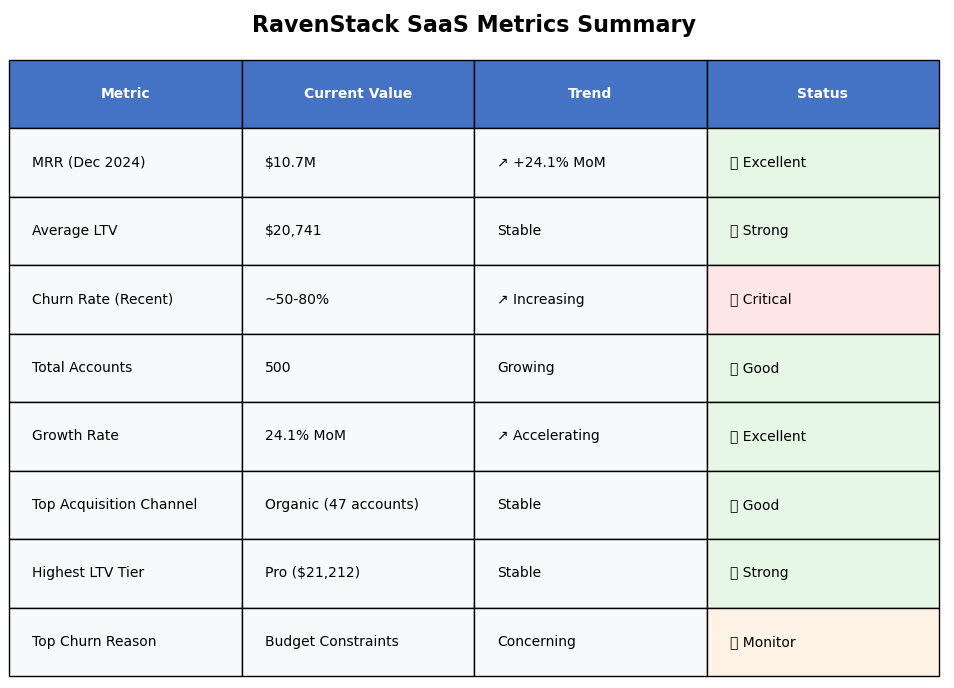
End Results & Recommendations
Executive Summary Table: A summary matrix outlining key metrics, status indicators and trends.
Challenges & Solutions
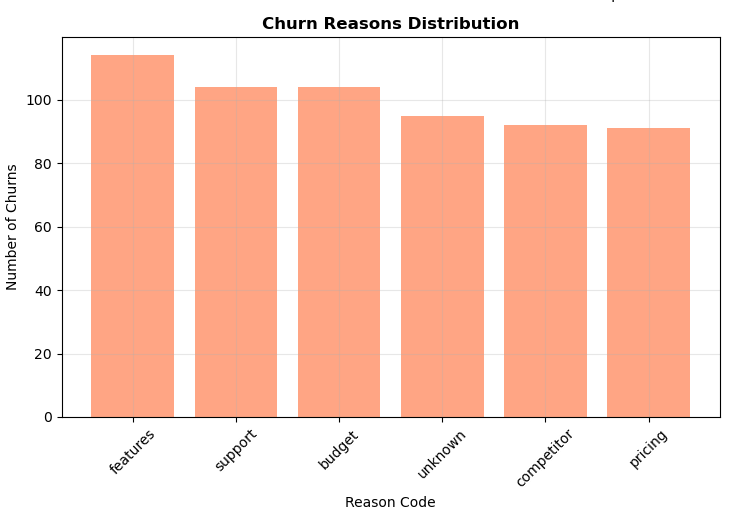
- Challenge: Churn calculations produced "inf" values due to zero active accounts.
- Solution: Fixed with logic to exclude zero-denominator months.
- Challenge: LTV Estimation on Ongoing Subscriptions
- Solution: Handled ongoing plans by assigning a 12-month projected lifetime unless otherwise defined.
- Challenge: Plan Tier Normalization
- Solution: Merged accounts and subscriptions to cleanly associate plan tiers across datasets.
Recommendations
- Address Churn Urgently: The dramatic increase in churn rates (especially in Q4 2024) is a critical issue that needs immediate investigation
- Leverage High Growth: Your 24% MoM growth is excellent - focus on scaling what's working
- Optimize Pro Tier: Pro customers have the highest LTV - consider strategies to convert more customers to this tier

Immediate Actions (Next 30 Days) to Address Churn
To design and implement a dynamic, investor-ready KPI dashboard that gives startup founders and stakeholders clear, up to date visibility into key business metrics:
- Fix the top 5 error-prone features
- Setup early warning system for churn
- Implement automated escalation for tickets >24 hours
- Launch exit interview program
- Create customer health score dashboard
- Begin competitive analysis project to identify gaps and monitor competitor feature releases and pricing
Conclusion
With the right analytical approach, raw CSVs can be turned into actionable dashboards that drive funding, retention, and growth strategy. RavenStack is now equipped with a strong narrative for investors and internal alignment around performance metrics.
Copyright © 2025 Lunexa Insights. All rights reserved.