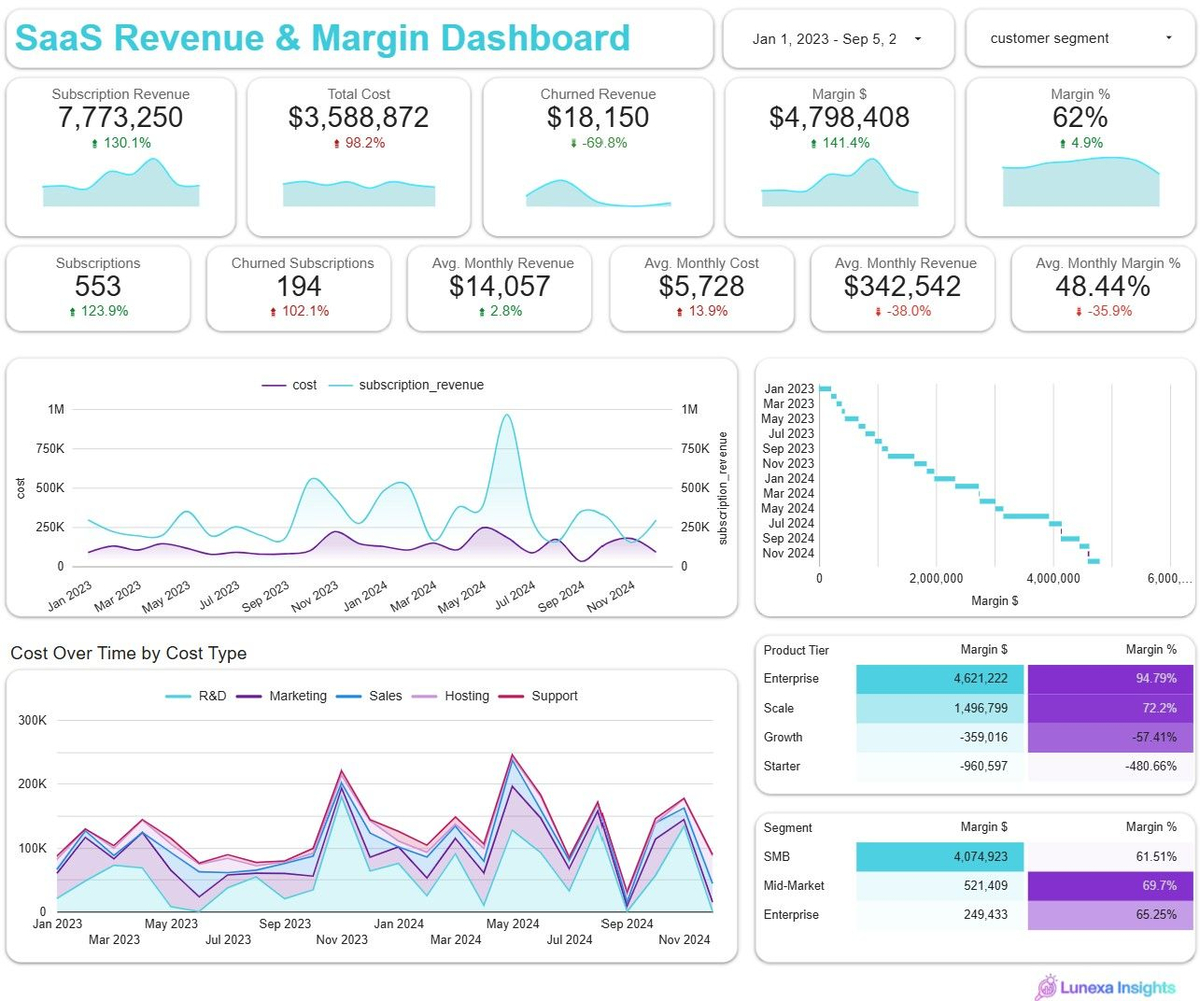
Executive Dashboard for Revenue & Margin Reporting
Leadership couldn’t see if the business was actually making money. Revenue sat in one silo, costs in another, and no one had a trusted monthly view of margin. Without clarity, decisions on hiring, pricing, and fundraising risked being guesswork. Lunexa Insights delivered a transparent revenue and margin tracker that surfaced true month-over-month profitability, turning uncertainty into confident, data-backed growth moves.

Context
The client’s finance team had siloed data across billing and expense systems. Without a consolidated monthly P&L, they were unable to:
- Accurately measure gross margin.
- See cost mix trends over time.
- Align product and marketing decisions to profitability.
Objective
- Create a unified monthly revenue, cost, and margin tracker.
- Enable leadership to monitor profitability trends.
- Provide a cost breakdown by type to guide resource allocation.

Role
Senior Data Analyst @ Lunexa Insights — designed and delivered the analysis end‑to‑end.
Duration
1 week (from prototype to executive‑ready deliverables).
Tools & Methodologies
- Python (pandas, plotly) for data expansion & aggregation
- CSV exports for finance team
- BI dashboard‑ready metrics for Looker Studio
- Data prep: subscription expansion, monthly grouping, margin calculations
The Approach and Process
1. Revenue Expansion
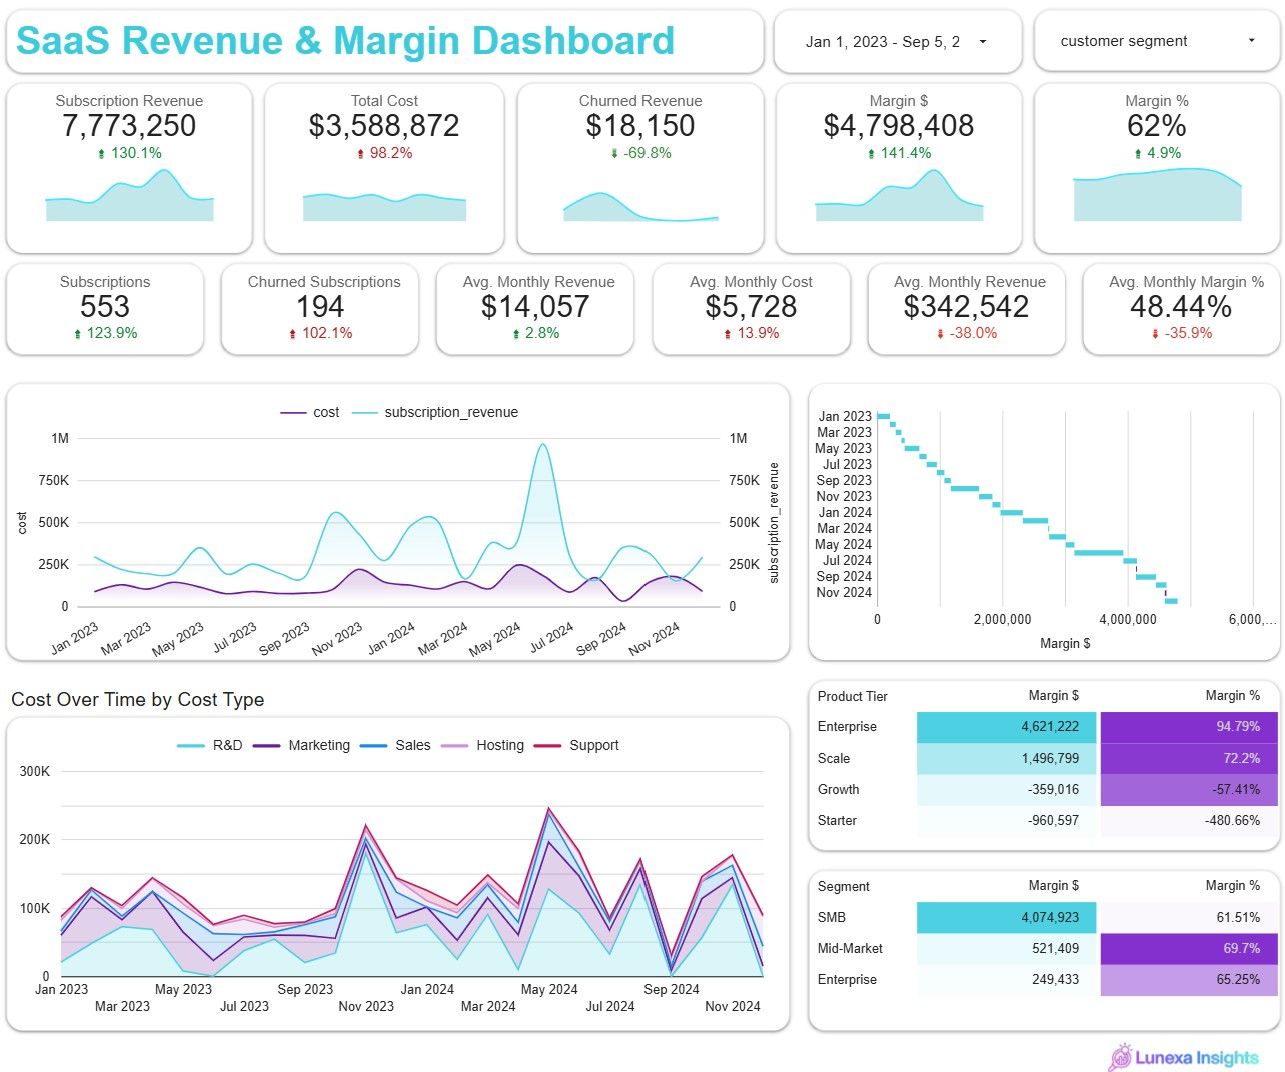
Revenue grows steadily month-over-month after launch, recognition aligns with subscription duration.
- Revenue scaled from $0 to a peak of about $345k/month before tapering off.
- Operating costs held between $120k–$200k/month for most of the period.
- Break-even occurred as revenue crossed ~$160k/month, roughly mid-way through the growth curve.
- By the end of the timeline, revenue declined toward $0, while costs stabilized at ~$120k/month, erasing margins.
# subs_monthly, rev_monthlysubs = subscriptions_df.copy()subs['months_active'] = pd.to_numeric(subs['months_active'], errors='coerce').clip(lower=1)subs['subscription_revenue'] = pd.to_numeric(subs['subscription_revenue'], errors='coerce')subs['monthly_rev'] = subs['subscription_revenue'] / subs['months_active']expanded_rows = []for _, row in subs.iterrows(): for m in range(int(row['months_active'])): month_key = (row['start_date'] + pd.offsets.MonthBegin(0)) + pd.DateOffset(months=m) month_key = pd.Timestamp(year=month_key.year, month=month_key.month, day=1) expanded_rows.append({'customer_id': row['customer_id'], 'product_tier': row['product_tier'], 'month': month_key, 'monthly_rev': row['monthly_rev']})subs_monthly = pd.DataFrame(expanded_rows)rev_monthly = subs_monthly.groupby('month', as_index=False)['monthly_rev']\ .sum().rename(columns={'monthly_rev':'revenue'})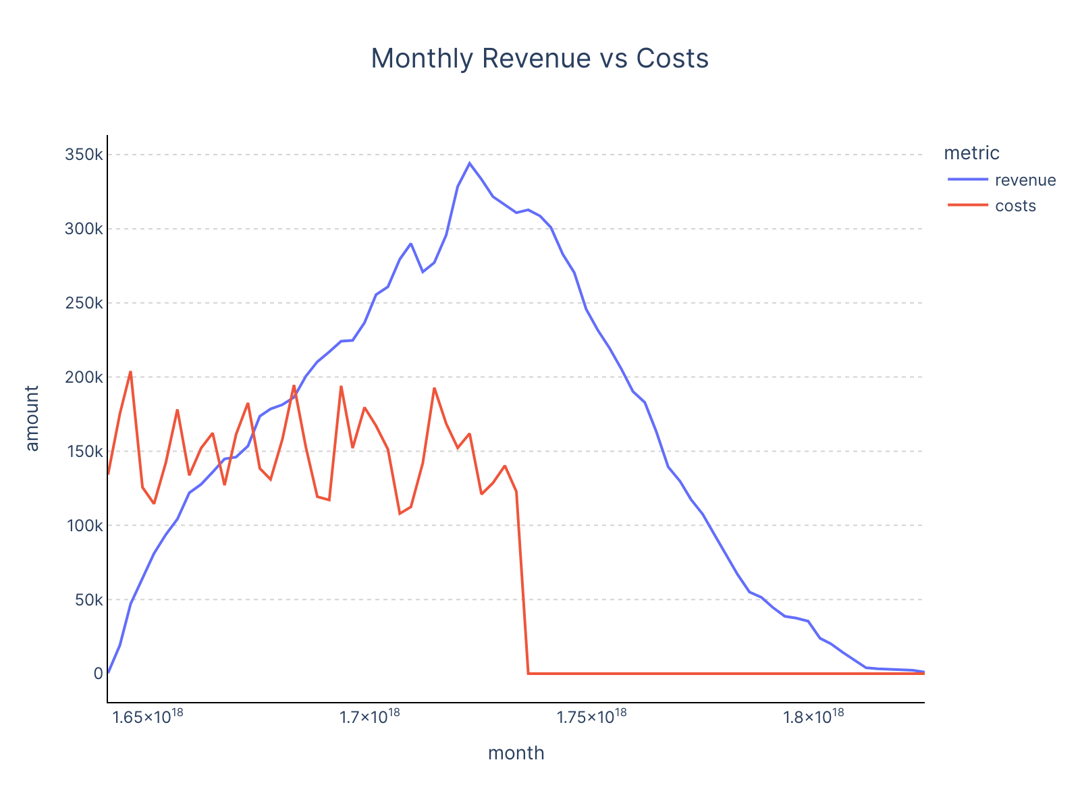
2. Monthly Cost Consolidation
- R&D dominated the cost base, averaging $90k–$100k/month and spiking as high as $120k+.
- Marketing ran $40k–$70k/month, with spikes exceeding $70k during campaign periods.
- Hosting was relatively steady at $10k–$20k/month, accounting for under 10% of total costs.
- Sales and Support together stayed modest, generally <15% combined share of monthly costs.
- Peak spending occurred around early 2023, with total costs surpassing $200k in a single month, largely from surges in R&D and Marketing.
# 4) Cost-type breakdown by month (stacked area)costs_breakdown_long = costs_breakdown_df.sort_values('month')fig_png = px.area(costs_breakdown_long, x='month', y='cost_value', color='cost_type', title='Monthly Costs by Type (Stacked)')fig_png.update_layout( font=dict(family='Inter, Arial, Sans-Serif'), title=dict(font=dict(size=20), x=0.5), plot_bgcolor='white', paper_bgcolor='white', xaxis=dict(showgrid=False, showline=True, linecolor='black'), yaxis=dict(showgrid=True, griddash='dot', gridcolor='lightgray', showline=True, linecolor='black'))png_bytes = pio.to_image(fig_png, format='png', width=800, height=600, scale=2)display(Image(png_bytes))print('Rendered stacked area chart: Monthly Costs by Type')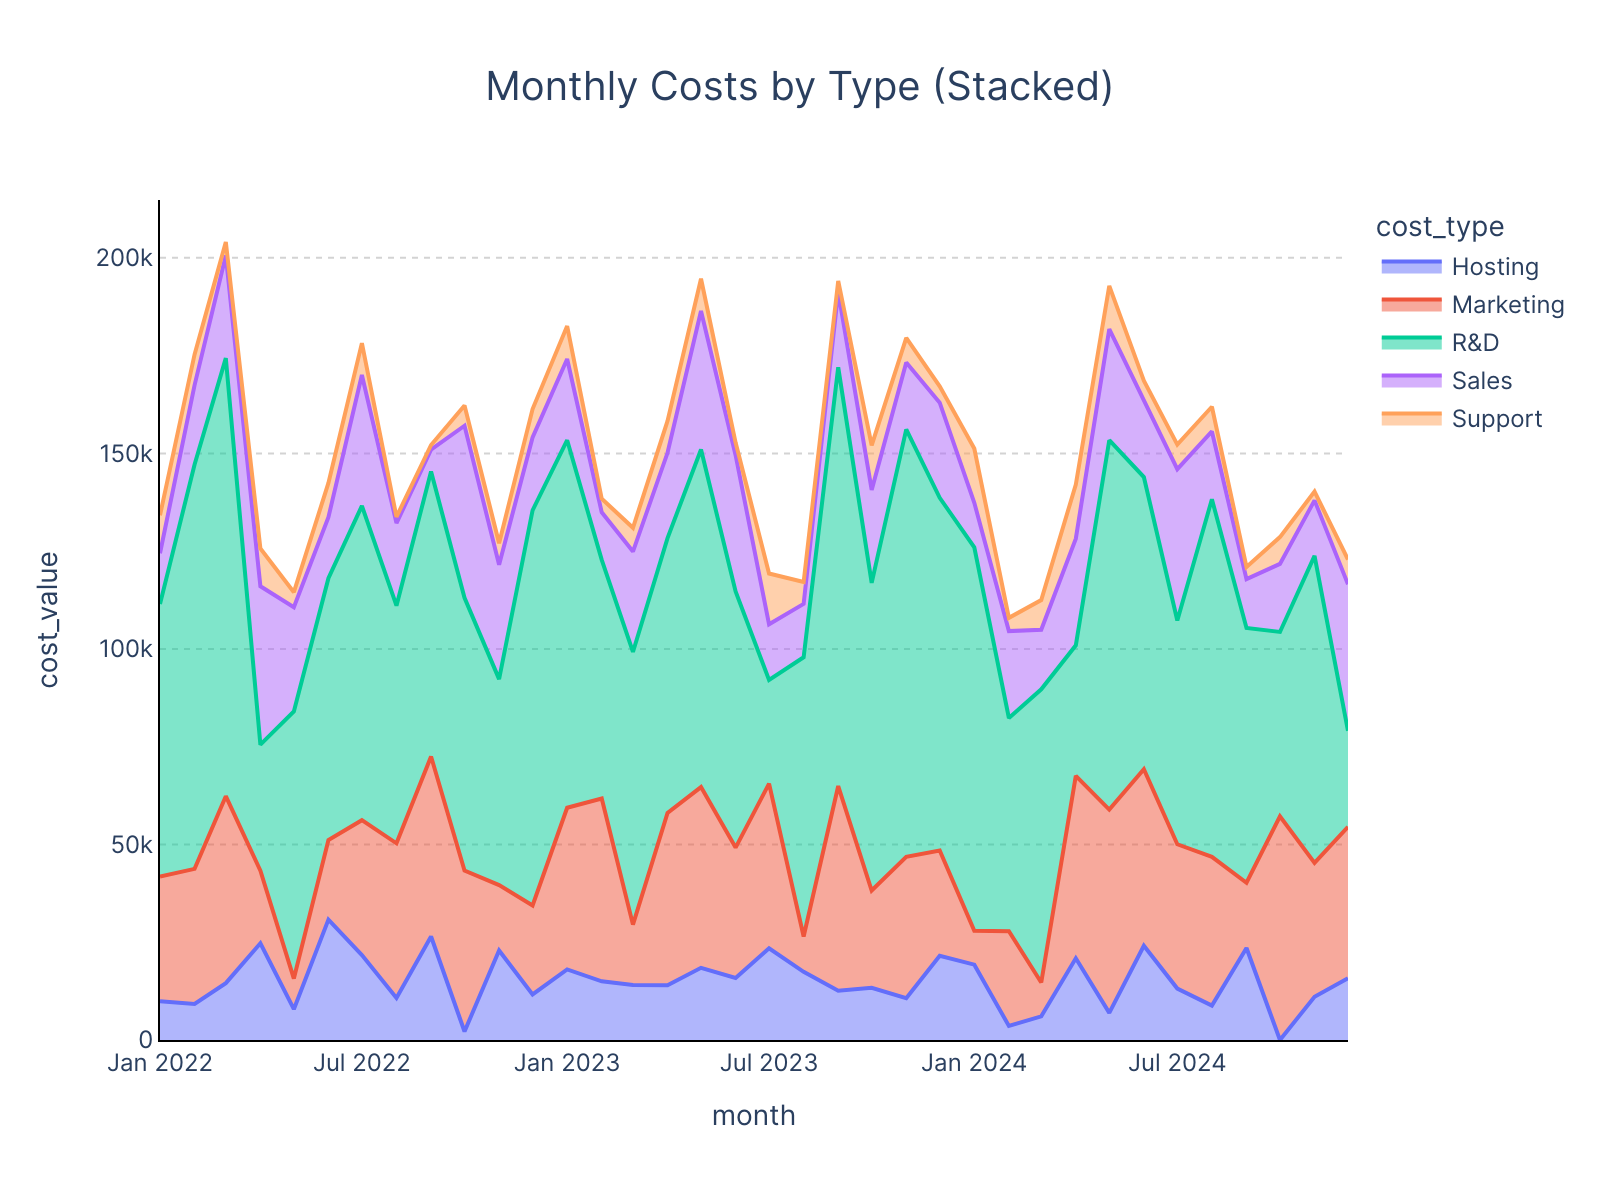
4. Gross Margin Analysis
- Early months were negative, with losses as steep as −$150k/month before revenue scale.
- Gross margin turned positive once revenue passed costs, climbing steadily.
- Peak gross margin reached ~$310k/month, representing the most profitable point of the period.
- After that, margins declined in line with revenue, trending back toward $0 by the end of the timeline.
# Create the Monthly Gross Margin bar chartfig_png = px.bar(pnl_df.sort_values('month'), x='month', y='gross_margin', title='Monthly Gross Margin')# Apply Blue Theme stylingfig_png.update_layout( font=dict(family='Inter, Arial, Sans-Serif'), title=dict(font=dict(size=20), x=0.5), plot_bgcolor='white', paper_bgcolor='white', xaxis=dict(showgrid=False, showline=True, linecolor='black'), yaxis=dict(showgrid=True, griddash='dot', gridcolor='lightgray', showline=True, linecolor='black'))# Convert to PNG and displaypng_bytes = pio.to_image(fig_png, format='png', width=800, height=600, scale=2)display(Image(data=png_bytes))print('Monthly Gross Margin bar chart rendered successfully')print('')print('Key code components for this visualization:')print('1. Calculate gross_margin = revenue - costs')print('2. Use px.bar() with month on x-axis, gross_margin on y-axis')print('3. Sort data by month for proper chronological display')print('4. Apply Julius Business Theme with Inter font and clean styling')print('5. Export as high-resolution PNG (800x600, scale=2)')# Show a sample of the data being plottedprint('')print('Sample of gross margin data:')print(pnl_df[['month', 'revenue', 'costs', 'gross_margin']].head())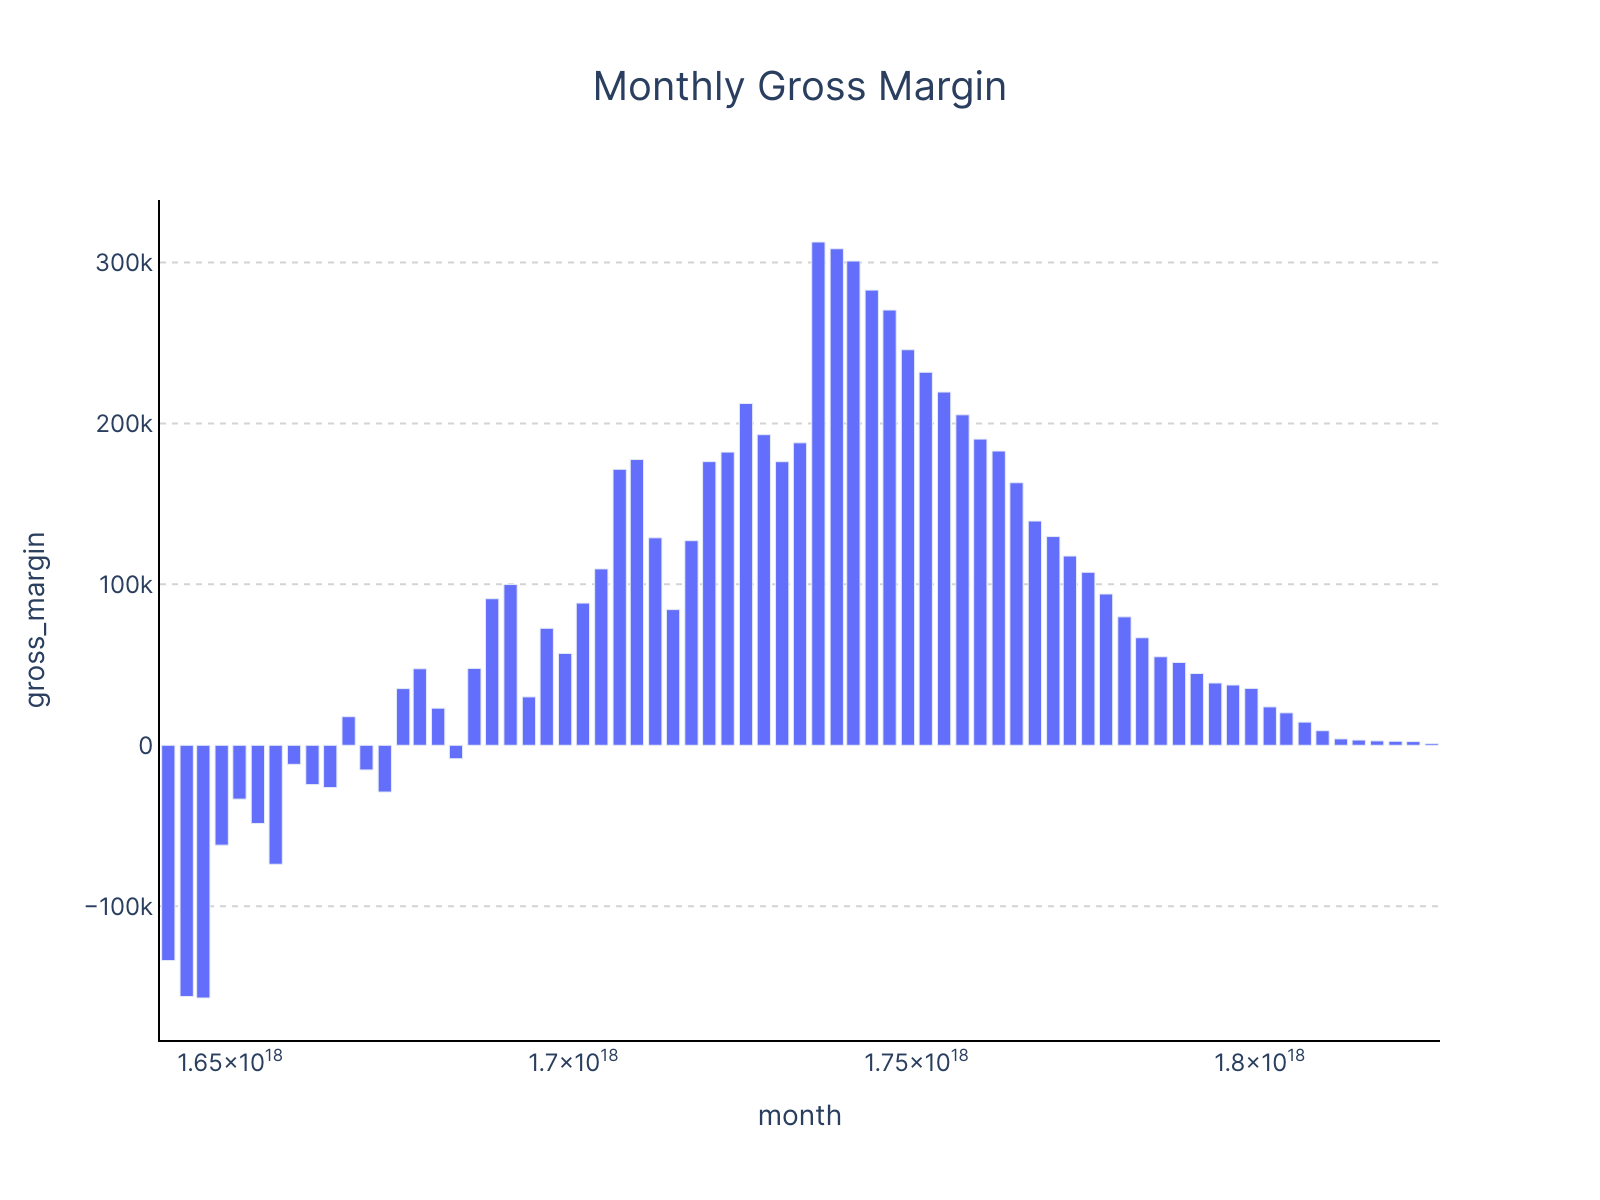
End Results & Recommendations
Delivered a single source of truth dashboard with revenue, costs, gross margin, and GM%.
Leaders can now see margin drivers and cost mix in one view.
Challenges & Solutions
- Challenge: Subscription revenue was stored as total contract value, not monthly.
- Solution: Straight‑line expansion by months_active with flexibility to replace with invoice schedules.
- Challenge: Costs were unaligned across multiple categories.
- Solution: Normalized to first‑of‑month keys and grouped by cost-type.
Recommendations
- Add alerts for overspending in Marketing or R&D.
- Track Hosting % of Revenue as a performance efficiency metric.
- Extend margin tracking to product‑tier level.
- Replace straight‑line revenue allocation with true invoice schedules when available.

Immediate actions (Next 30 Days)
Profitability guardrails
- Set monthly burn guardrails tied to pipeline coverage (e.g., 3x next-quarter revenue coverage to allow elevated spend).
- Add a 6-month rolling margin projection to the tracker to visualize the payback of current spend.
Cost optimization plan
- Hosting: Renegotiate instance pricing/commit discounts; set autoscaling thresholds; target 10-15% COGS reduction.
- Support: Expand self-serve; deflect top 5 ticket types; aim for a 20% reduction in tickets per active account.
- Marketing: Tighten CAC by shifting to channels with higher LTV/CAC; cap at 3.0 for Growth, 4.0 for Scale.
Revenue mix and pricing
- Lean into Scale tier: Optimize packaging and discount policy to protect ARPA; implement annual prepay incentives to pull forward cash.
- Reduce revenue leakage: Track downgrades and grace-period churn and move to proration policies that reduce unrecognized use.
Operational Instrumentation
- Add cost-type budgets with variance alerts in the monthly tracker.
- Introduce a waterfall (Revenue → cost types → Margin) for the latest month and last quarter.
- Add LTV/CAC by segment and cohort retention overlays on revenue curves.
Conclusion
By consolidating revenue and cost data into a monthly P&L tracker, Lunexa Insights gave the client clear visibility into their profitability journey. With transparent assumptions and actionable visuals, leadership can now manage resources more effectively, plan campaigns around margin trends, and build a sustainable growth strategy.
Copyright © 2025 Lunexa Insights. All rights reserved.